
Branding is all about how a company represents itself, inside and out. With analytics, you can see if people are loving what your stuff is, or hating it.
No matter how smart you are, it’s impossible to do this alone. Advanced tools can quickly and accurately gather tons of qualitative and quantitative data before putting it together in a user-friendly report. Ready for you to take action and tweak your branding strategy if need be.
One of which is Amazon Brand Analytics, which we will cover in much more detail later on. And trust us, if you want help becoming the best seller on the behemoth marketplace that is Amazon, you’ll want to hear us out.
Why should you care about Brand Analytics?
Amazon Brand Analytics (ABA) is a handy Amazon Seller Central and Amazon Vendor Central tool for sellers wanting marketplace insights to improve their product’s success.
Brand Analytics isn’t just for people who love numbers and line graphs; it is for anyone who is struggling to make the desired impact on their marketplace. Amazon has always tried to bump up the underdogs and give them a shot at success, and with this tool, they have done just that.
The Brand Analytics tool covers in fine detail how a seller’s product is performing on Amazon through search terms, search frequency rank, conversion rates, and much more.
The top 5 Brand Aalytics to keep an eye on
Amazon is vast, and with this comes lots of data. Amazon’s Brand Analytics tool does all the hard work and collects metrics from searches, purchases, and product views to include in its reports, all the while protecting customer privacy.
For those beginning their journey with Amazon’s Brand Analytics software, it’s hard to make sense of all the numbers and jargon. Fortunately, they have focused on the five most important areas of Brand Analytics to keep an eye on.
1. Amazon search terms
When users look for a product, they type in search terms, also known as keywords. Amazon’s Brand Analytics search terms report compiles these keywords, displaying the best ones to use going forward.
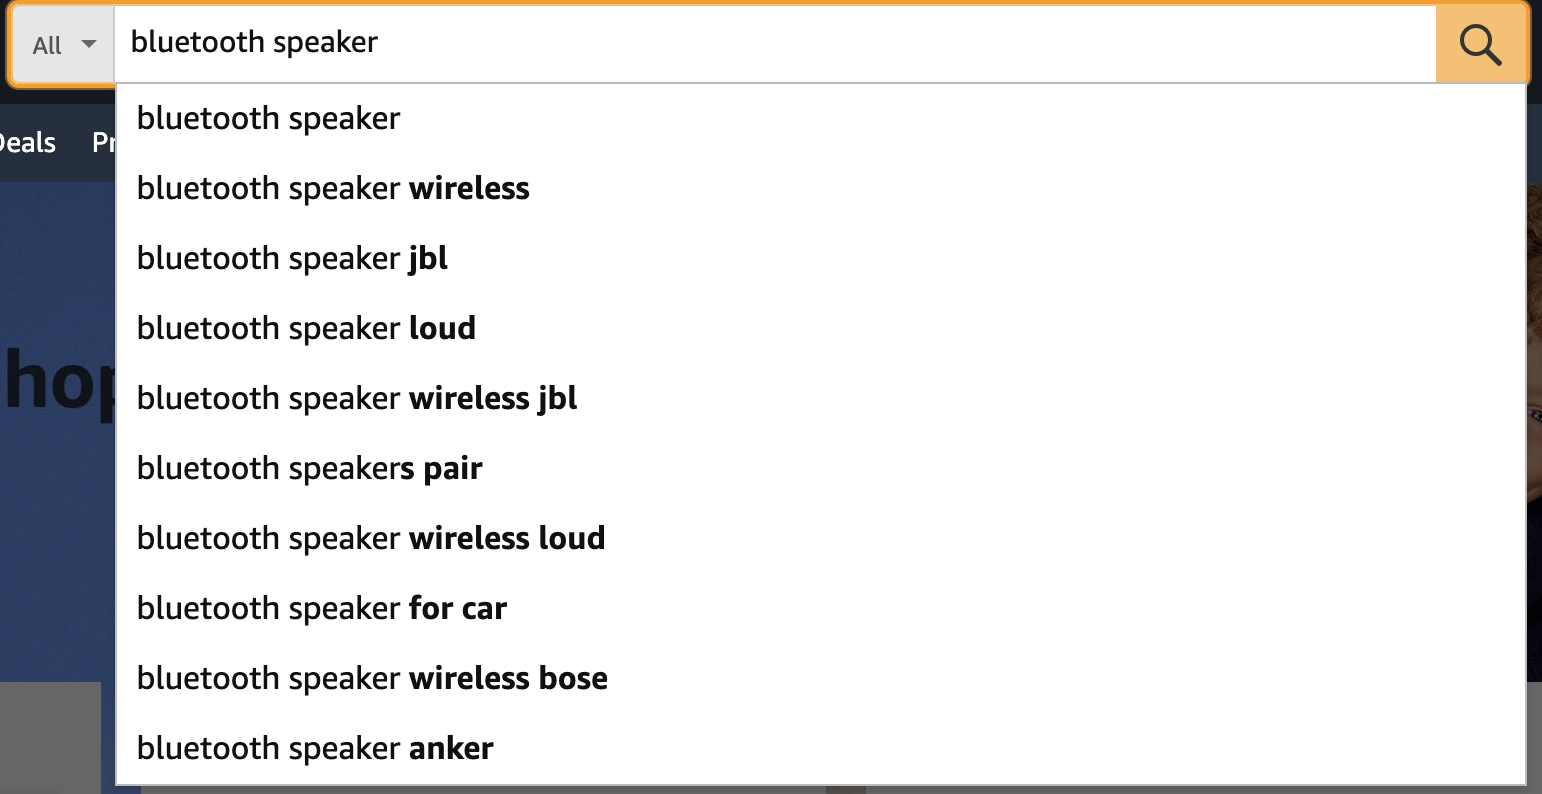
You’ll want to pay attention to these terms as they give you the knowledge needed for incorporating more of them into product titles, descriptions, and detail pages.
In the search terms report, you will see details of the following:
- Search terms: The keywords users type into Amazon’s search bar when looking for a product.
- Search frequency: Compares the strength of each keyword by showing how different products rank at any given time.
- Click share: The percentage of how often your (or a competitor’s) product is clicked on after searching a particular term.
- Conversion share: The number of users who completed a purchase after using search terms to find it.
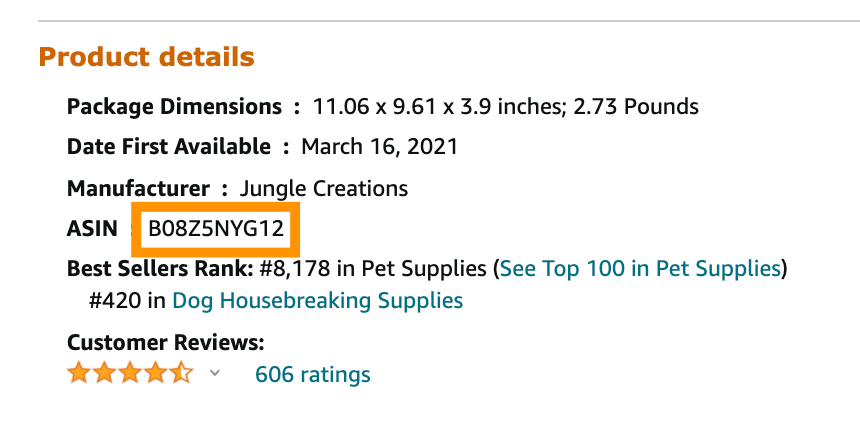
Amazon’s Brand Analytics software also shows the top three product ASINs (Amazon Standard Identification Number) that are clicked on most depending on the term used to find them.
The keyword search report is incredibly valuable for seeing what possible search terms you’re missing out on. By applying what you now know, you can bump up your product listings and enjoy higher conversion rates.
Leaving keywords up to guesswork or trial and error may sound like a good idea, but in the competitive land of online marketplaces, risking the success of your product should not be taken lightly.
After all, why waste time at the bottom when you deserve to be at the top?
1. Repeat purchase behavior
This report will tell you everything about products with a high chance of being purchased repeatedly. It also shows if they were bought by unique customers or repeat ones, with an overview of the total number of orders to give you the bigger picture.
Retaining customers is one of the many battles companies face due to competition swooping in and taking them away. However, if you maintain high rates of repeat purchases, customers will only have eyes for you.
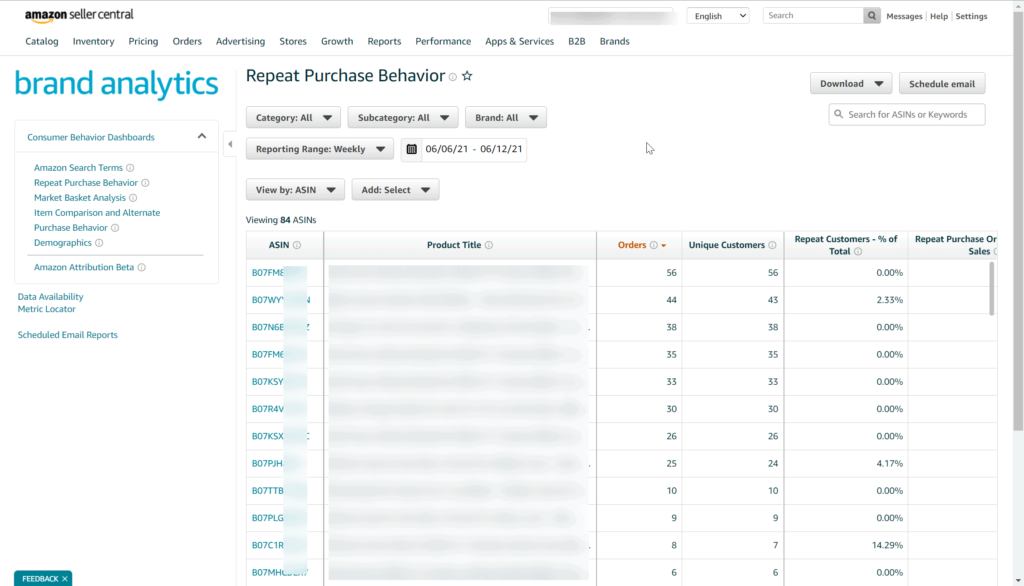
Getting your hands on this report will do wonders for knowing which products to promote and which ones to you’re throwing money down the drain for. However, remember that the repeat purchase behavior report data is limited in showing individual customer details. It only displays what products have been purchased more than once.
There are many benefits to knowing which of your products are most successful, such as:
- Knowing what products to keep well-stocked
- Finding a target audience
- Where to focus marketing strategies
3. Market basket analysis
Amazon’s market basket analysis shows the top three products bought along with yours in the same basket. It shows each product’s ASIN, title, and purchase combinations. This report is especially useful for increasing revenue.

How so? You can see missed opportunities by seeing what other items are in a customer’s basket at checkout. For example, if you sell pencils but no erasers, it’s only natural for customers to buy the missing part of the duo elsewhere. Giving competitors this kind of power is doing you no favors.
So, by bundling the pencil and eraser together, suddenly, they have everything they need in just one click, and you get to enjoy increased revenue and market share.
4. Item comparison and alternate purchase behavior
This Brand Analytics report shows the top three products that were compared to yours and how often you were tossed aside as a result. You’ll definitely want to see this, though, as it will give valuable insight into where your product is falling short.
You can use this information to develop new advertising strategies aimed at competitors, showcasing how your product is in fact better than theirs. This report may also change business decisions as far back as production. Marketing can only go so far, so in most instances, a product tweak here and there could be the best way forward.
This report also helps with:
-
Search Engine Optimization (SEO): Keywords in competitors’ product pages can be incorporated into your own to rank higher in search results. As your product gets more visibility, it will soon become the favored option.
-
Pay-per-click (PPC): By knowing what makes Amazon shoppers choose a competitor over you, it is easier to focus on these points in targeted advertising.
5. Demographics
Knowing your audience is essential for accommodating their needs and preferences. With Amazon’s demographics report, you will see your customers’:
-
Gender
-
Age
-
Education
-
Marital status
-
Household income
Metrics such as the total product sales, the percentage of unique buyers, and total orders placed are all laid out for you in this report. All that’s left for you to do is harness it and cater to the target audience.
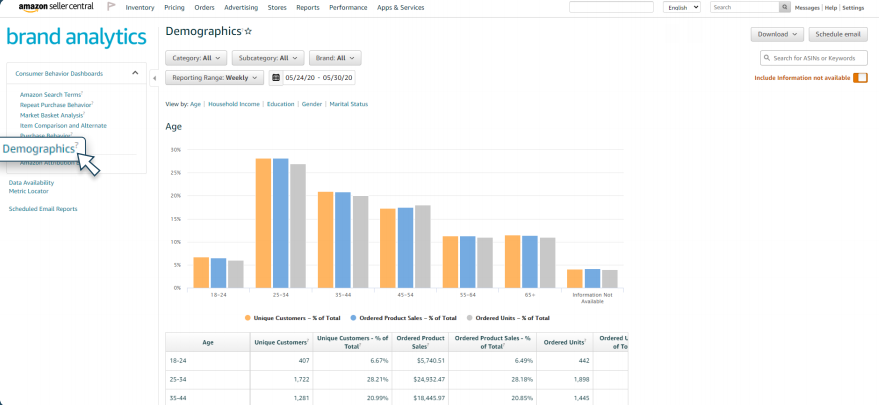
Is there an age group you hoped to attract but have proven unsuccessful? Or maybe there’s a surprising amount of married people buying your product aimed at bachelors? Whatever hitch you are experiencing, having insight into these demographics helps navigate future marketing efforts.
Before you can use Amazon’s Brand Analytics
Unfortunately, not just anyone can use Brand Analytics. You must become a member of the Amazon brand registry. Not only is this a requirement, but it also helps to protect and manage your brand’s intellectual property.
To make the cut for the registry, you must:
- Be a brand owner or representative
- Sell on Amazon
- Have an active registered trademark
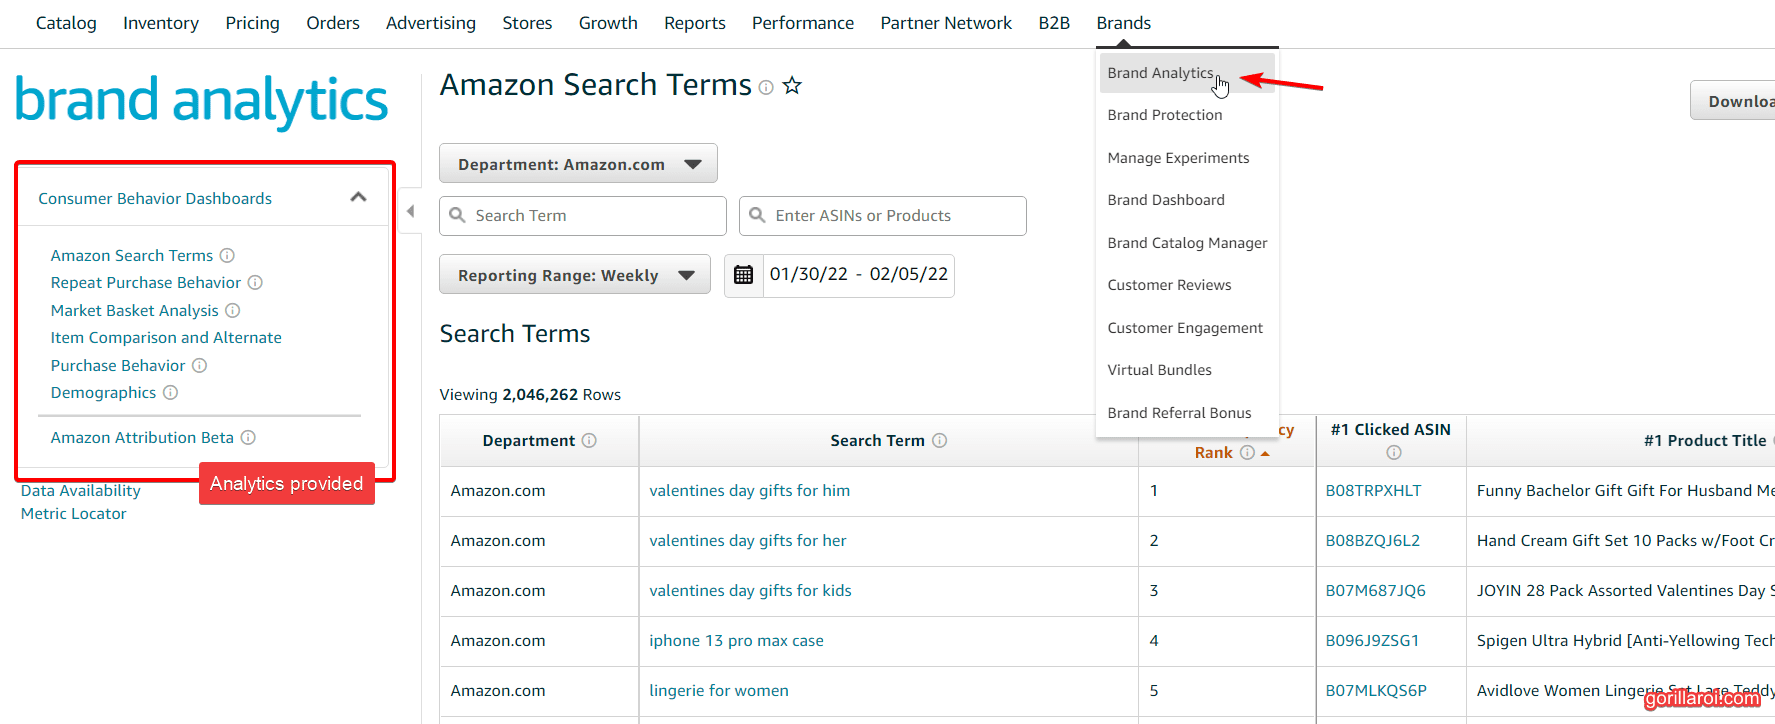
Once you have done that, the next step is to access the software and get started. To do this, open up the Amazon Seller Central account and head to the Brand Analytics tab in the top right. From there, the reports available to you will show in a dropdown menu.
Why you should use Amazon’s Brand Analytics
To earn a spot on the front page using Brand Analytics is more of a necessity than a choice. Here are just some of the many benefits that come with using this software.
Understand customer behavior
With the item comparison and alternate purchase behavior report, valuable information is given on what products are beating yours when compared by customers. What is it they’re looking for that you can’t give? With Amazon’s Brand Analytics, it all becomes much clearer.
Customers are no longer just numbers on a screen, and by better understanding them, marketing strategies and targeted advertising can be customized to give them what they’ve been missing.
In fact, almost all strategic decisions concerning your product’s performance on Amazon’s marketplace will (and should) be influenced by customer behavior. This not only makes your product more successful but also instills confidence and trust in your target audience.
Understanding what customers want goes a long way, and when done sooner rather than later, it can take you right to the top.
Gain competitive insights
It’s vital to know what you’re up against regarding competitors. This is the only way to be inspired by their strengths and leveraged by their weaknesses. They say comparison is the thief of joy, but a failing e-commerce business is arguably more so in this instance.
With the brand analytics tool, aspects include search terms they are using, what products they have alongside yours in customer baskets, and instances where they were favored over you or vice versa.
Having this information on hand allows you to identify competitors in the first place and how to differentiate yourself from them. Take a hard look and see what you can offer that they can’t, and use it as a strength in future marketing strategies.
Discover search terms and keywords
The Brand Analytics tool shows specific search terms and keywords that users have typed into the search bar when looking for products.
With the Amazon search terms report, you can see what language is used to describe what they’re looking for, giving a human perspective on the Amazon store typically dominated by numbers.
With this collection of search terms at your fingertips, it’s now easier than ever to incorporate ones you hadn’t thought of before. Product titles and descriptions are the perfect places to incorporate SEO with relevant, descriptive search terms to boost your product’s search results.
Gauge popular products
By analyzing the reports from Amazon’s Brand Analytics, you can paint a picture of what products dominate your market. How often are they chosen over others, and what particular terms are used to find them? These are just some of the questions that are answered with brand analytics.
When it comes to your inventory, knowing what items are bestsellers helps a lot with managing stock. Focusing resources on keeping a specific product in stock is less risky when you trust you’ll get a return on investment (ROI).
Due to things moving so fast in the digital world, if your item is out of stock even for a moment, it’s too easy for a once loyal customer to purchase a similar product from a competitor instead.
To rub salt in the wound, not only does an out-of-stock sign disappoint people, but it also makes your brand look unprepared and disorganized.
Better product positioning
The position of a product is essentially the proof that your product has a rightful place in the market and is offering something that competitors aren’t. The main focus should be highlighting unique selling points (USPs) to make it stand out and convince users they cannot be freed from their troubles elsewhere.
Establishing a gap in the market and using it as an advantage for selling a product sounds pretty straightforward – and it is as long as you know what you’re doing. All you need is Brand Analytics, and you will have the knowledge required to find common pain points in your target audience and how you can fix them more efficiently than competitors.
With a comfy spot in the market, it won’t take long for your product to be the next one to beat. To keep hold of this position, we suggest you keep tracking brand analytics and market trends.
It’s free and easy to use
Finally, what more convincing do you need other than Amazon’s Brand Analytics being completely free to use? It’s quite rare for software as useful as this not to require a subscription. Instead, it asks that you become a member of the brand registry program (also free).
In addition to this, you don’t need to be a computer whizz to figure out how it all works. Just a few simple clicks here and there, and reports will pop up in an easy-to-read format.
What else can Brand Analytics tell you?
We’ve covered the five reports that Amazon provides, but what other nuggets of wisdom can you get stuck into? By accessing Amazon’s Search Analytics Dashboard in your Seller Central account, there are metrics detailing product performance.
Two primary dashboards, namely Search Query Performance and Search Catalog Performance, have been kindly provided by Amazon. We will break these down to detail how you can benefit from them.
Search query performance
This dashboard monitors and analyzes Amazon’s search queries and what this means for your sales funnel. Here are examples of what you can find out through this dashboard.
Search impressions
This is a bit different from the search term report as it covers more than what keywords were used. Search impressions are how often your product popped up in a day, week, month, or any period of time. It will also display what terms were used for each search.
As you can imagine, if you have low search impressions, there’s something that needs fixing, whether it be product positioning or SEO. This tool is found on the Brand Analytics dashboard and lets you see where clicks can lead to conversions.
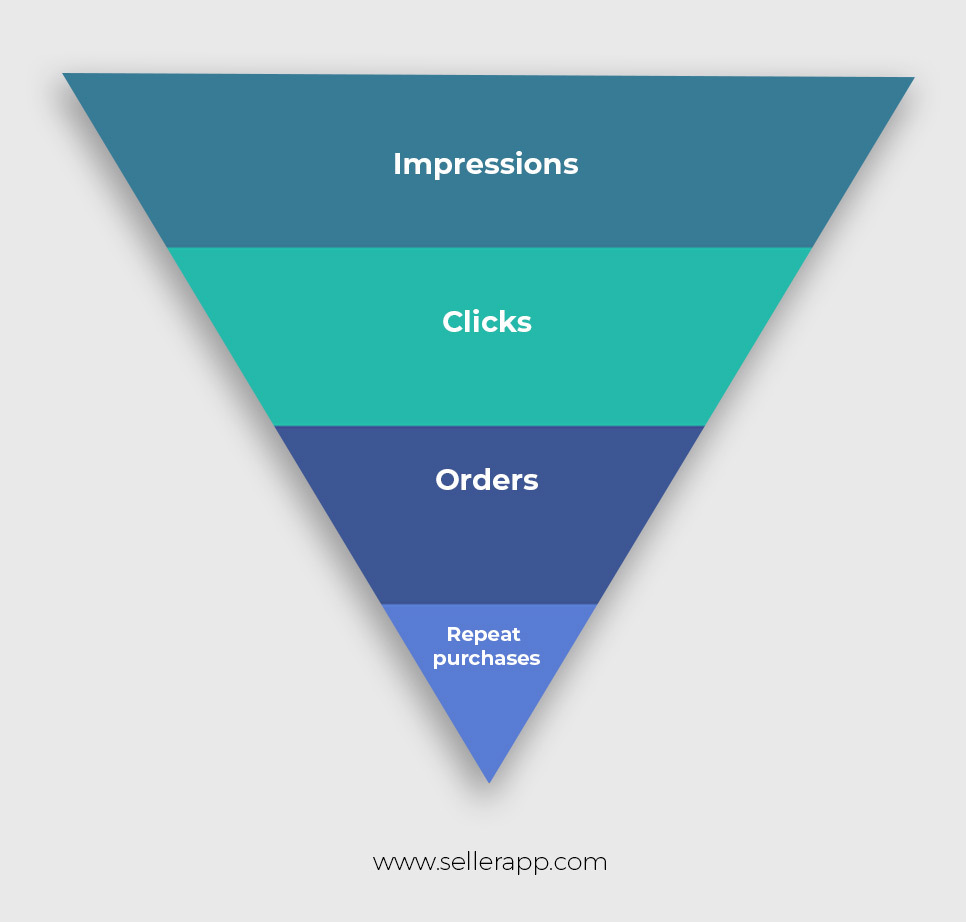
Click rates
Just because a product is doing great in the search impressions area, it doesn’t necessarily mean they are getting clicks. Amazon has a way of displaying products where the product image, price, and average review can be seen without having to click on them.
Therefore, if you are getting high impressions but low clicks, there’s clearly something putting people off before the product is given the time of day. Rightfully so, with so much choice, why would we settle?
Fixing whatever it is that’s making people scroll past is a huge benefit in letting your product page do the rest of the talking. If you’ve nailed the marketing, then high search impressions along with high click rates are a combination for success.
Conversions
When a user buys your product, it is referred to as a conversion as they are ‘converted’ from traffic into a buyer. With the Search Query Performance dashboard, you get a front-row seat to how particular search terms are used before a successful conversion.
This lets you see what terms are most valuable and may be missing from your product titles or descriptions. Over time, the performance of these keywords tends to fluctuate due to trends, seasons, and other external events. Monitoring these highs and lows can make the most of customer behavior instead of being blindsided by it.
Search catalog performance
Now that we have focused on the customers, it’s time to turn our attention to products. With the Search Catalog Performance Dashboard, sellers can break down the sales funnel of each product to see where Amazon shoppers are dropping off.
Fixing issues in the sales funnel could be as small as changing the tone of voice in product descriptions or fixing internal links. Whatever it may be, the buying experience must be as streamlined as possible. Any doubts, hesitations, or technical inconveniences are enough to make a product’s conversions plummet.
Using Brand Analytics to drive success
Amazon’s Brand Analytics tool is undoubtedly the best way to see where you’re falling short in the eyes of Amazon customers. It sounds like a lot of data to digest, but Amazon breaks it down into five reports deemed most important.
Brand Analytics’ power rests in understanding customer behavior, offering a clear advantage on what products resonate with consumers and why. Understanding the language they used to search, gauging their repeat purchase behavior, and peeking inside their baskets are vital for future decisions.
This is only a fraction of what this software can tell you. Amazon is a very busy, competitive place, and without using Brand Analytics, keeping up is harder than it needs to be.


